Introduction
Another blog site? Really?
Background
I've been a software engineer for the last ~decade or so. I took plenty of math classes in college like most other software engineers, and even minored in math. But, I suspect also like most engineers, I understood enough to do what I needed to do, and most of the rest of that knowledge has faded over the years of building business software. Similarly, I don't think I ever truly got most of the higher-level mathematical concepts being taught such that I grokked them in the same I did for more applied software concepts.
With all the recent (as of Nov 2026) advancements in mathematics and drama surrounding AI's role in mathematics, those old memories have been dug up and my interest around math has been re-piqued. Something about applied linear algebra being able to create a literal alien intelligence can really make a guy behold the glory of mathematics.
So with that new interest, I've been feeling an urge to express concepts in my job, or just for the sake of curiosity, using mathematics. I've been heavily binging videos from the GOAT himself, 3Blue1Brown. Grant does such an incredible job in these videos of intricately and intuitively visualizing very complex concepts that make them so much easier to understand on a deeper level.
However, when wanting to apply that same kind of articulation to the concepts I'm trying to explain, I've found the existing tooling pretty lacking. Tools like Medium and HashNode are great for text and images, and HashNode supports LaTeX. However, there's no sense of integrated visualizations in either of these blogging platforms. So folks, as far as I've seen, having to take images/gifs of their graphs or other visualizations, generated separately and pasted in. The other option is building your own custom site so you control the Javascript and can render whatever you want. That's a sucky option for most folks too, especially when they really just want to describe some dang equation or phenomenon.
But this is the year 2026! Much has happened since the manual effort days of 2024-25. The tide has turned. No more must we settle for copy/pasting images across platforms or converting videos to gifs or building custom sites for every complicated use case.
How's this better?
Well, let's say I want to explain Euler's Formula,
I could write a bunch of words about how represents a circle in the complex plane, and we know that the and make up the real and imaginary (i.e. X and Y) components of that circle, and those words are all fine and dandy and probably needed still. But if you've been out of the math game for a while like many software engineers, that can feel... pretty esoteric. So what if instead, we could very easily visualize and interact with that relationship inline here, like so?
Pretty cool huh? But boy, I sure don't want to take the time to go learn Three.js or Python or whatever library would let me make this quickest. And then what's the best way to get it into a blog format? Images? A gif?
Alas! This is one of the best use cases for the alien intelligence we find ourselves with - automating digital drudgery to more quickly accomplish your actual goals. In this case, conceptually explaining what the heck this formula means.
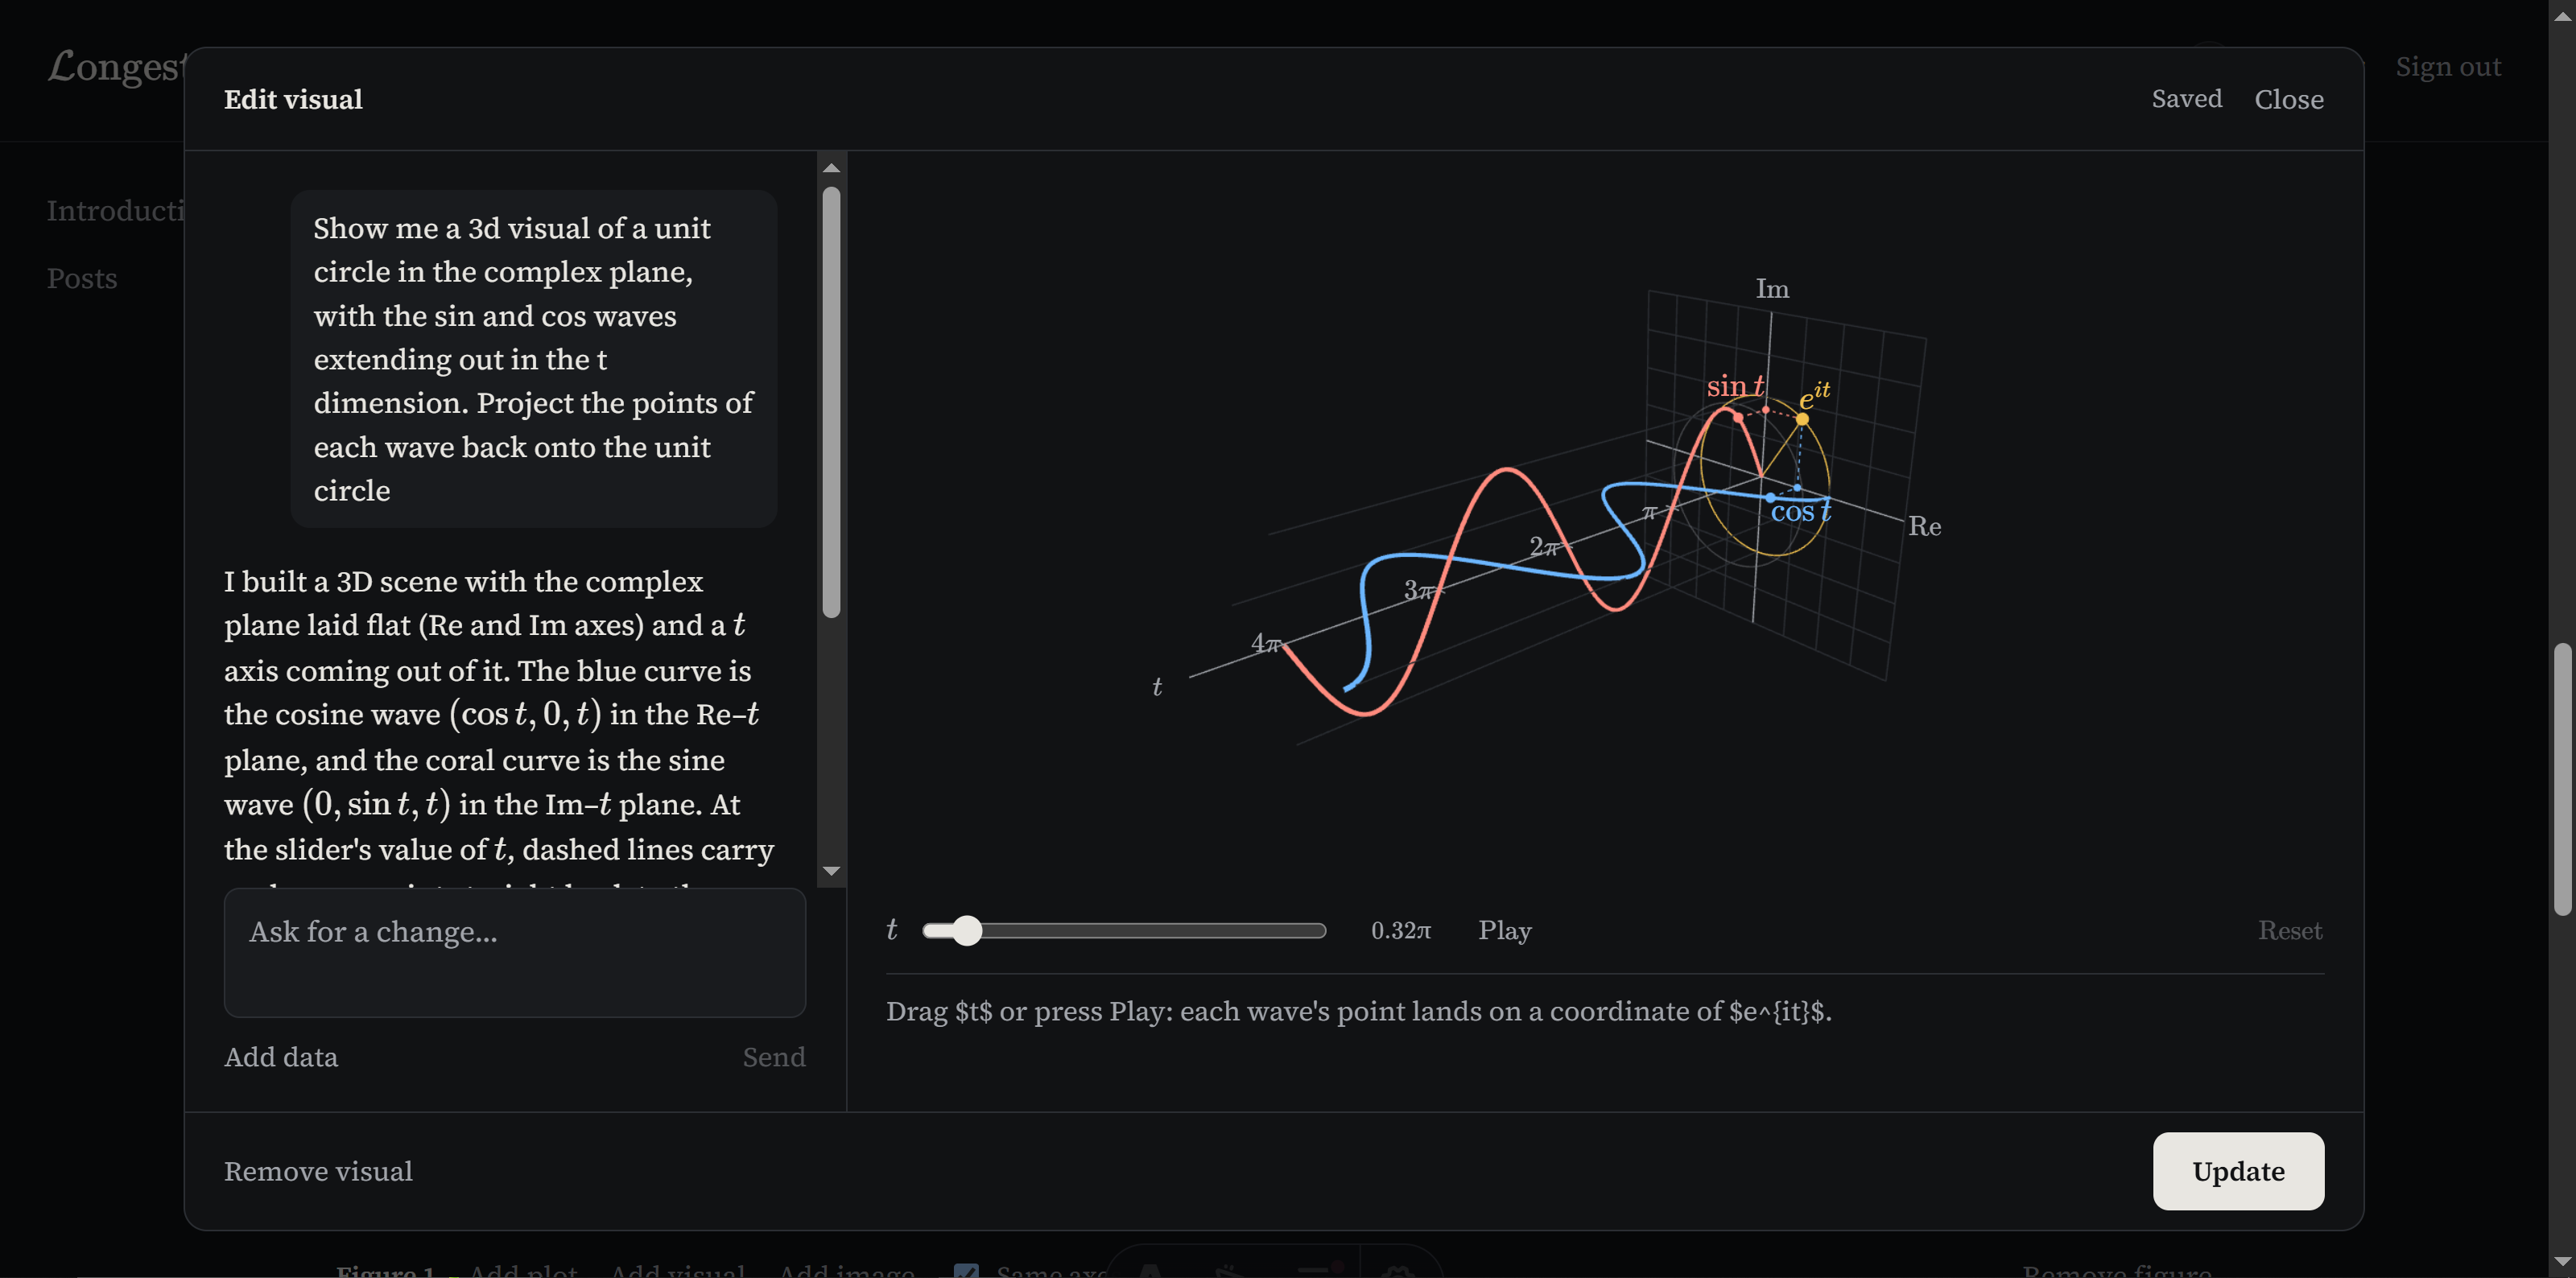
In Longest Fellow, you can get AI to build these types of interactive visuals for you in a few minutes (or less), letting you focus on the concepts and explanations instead of the code. Here's a screenshot of what this looks like:
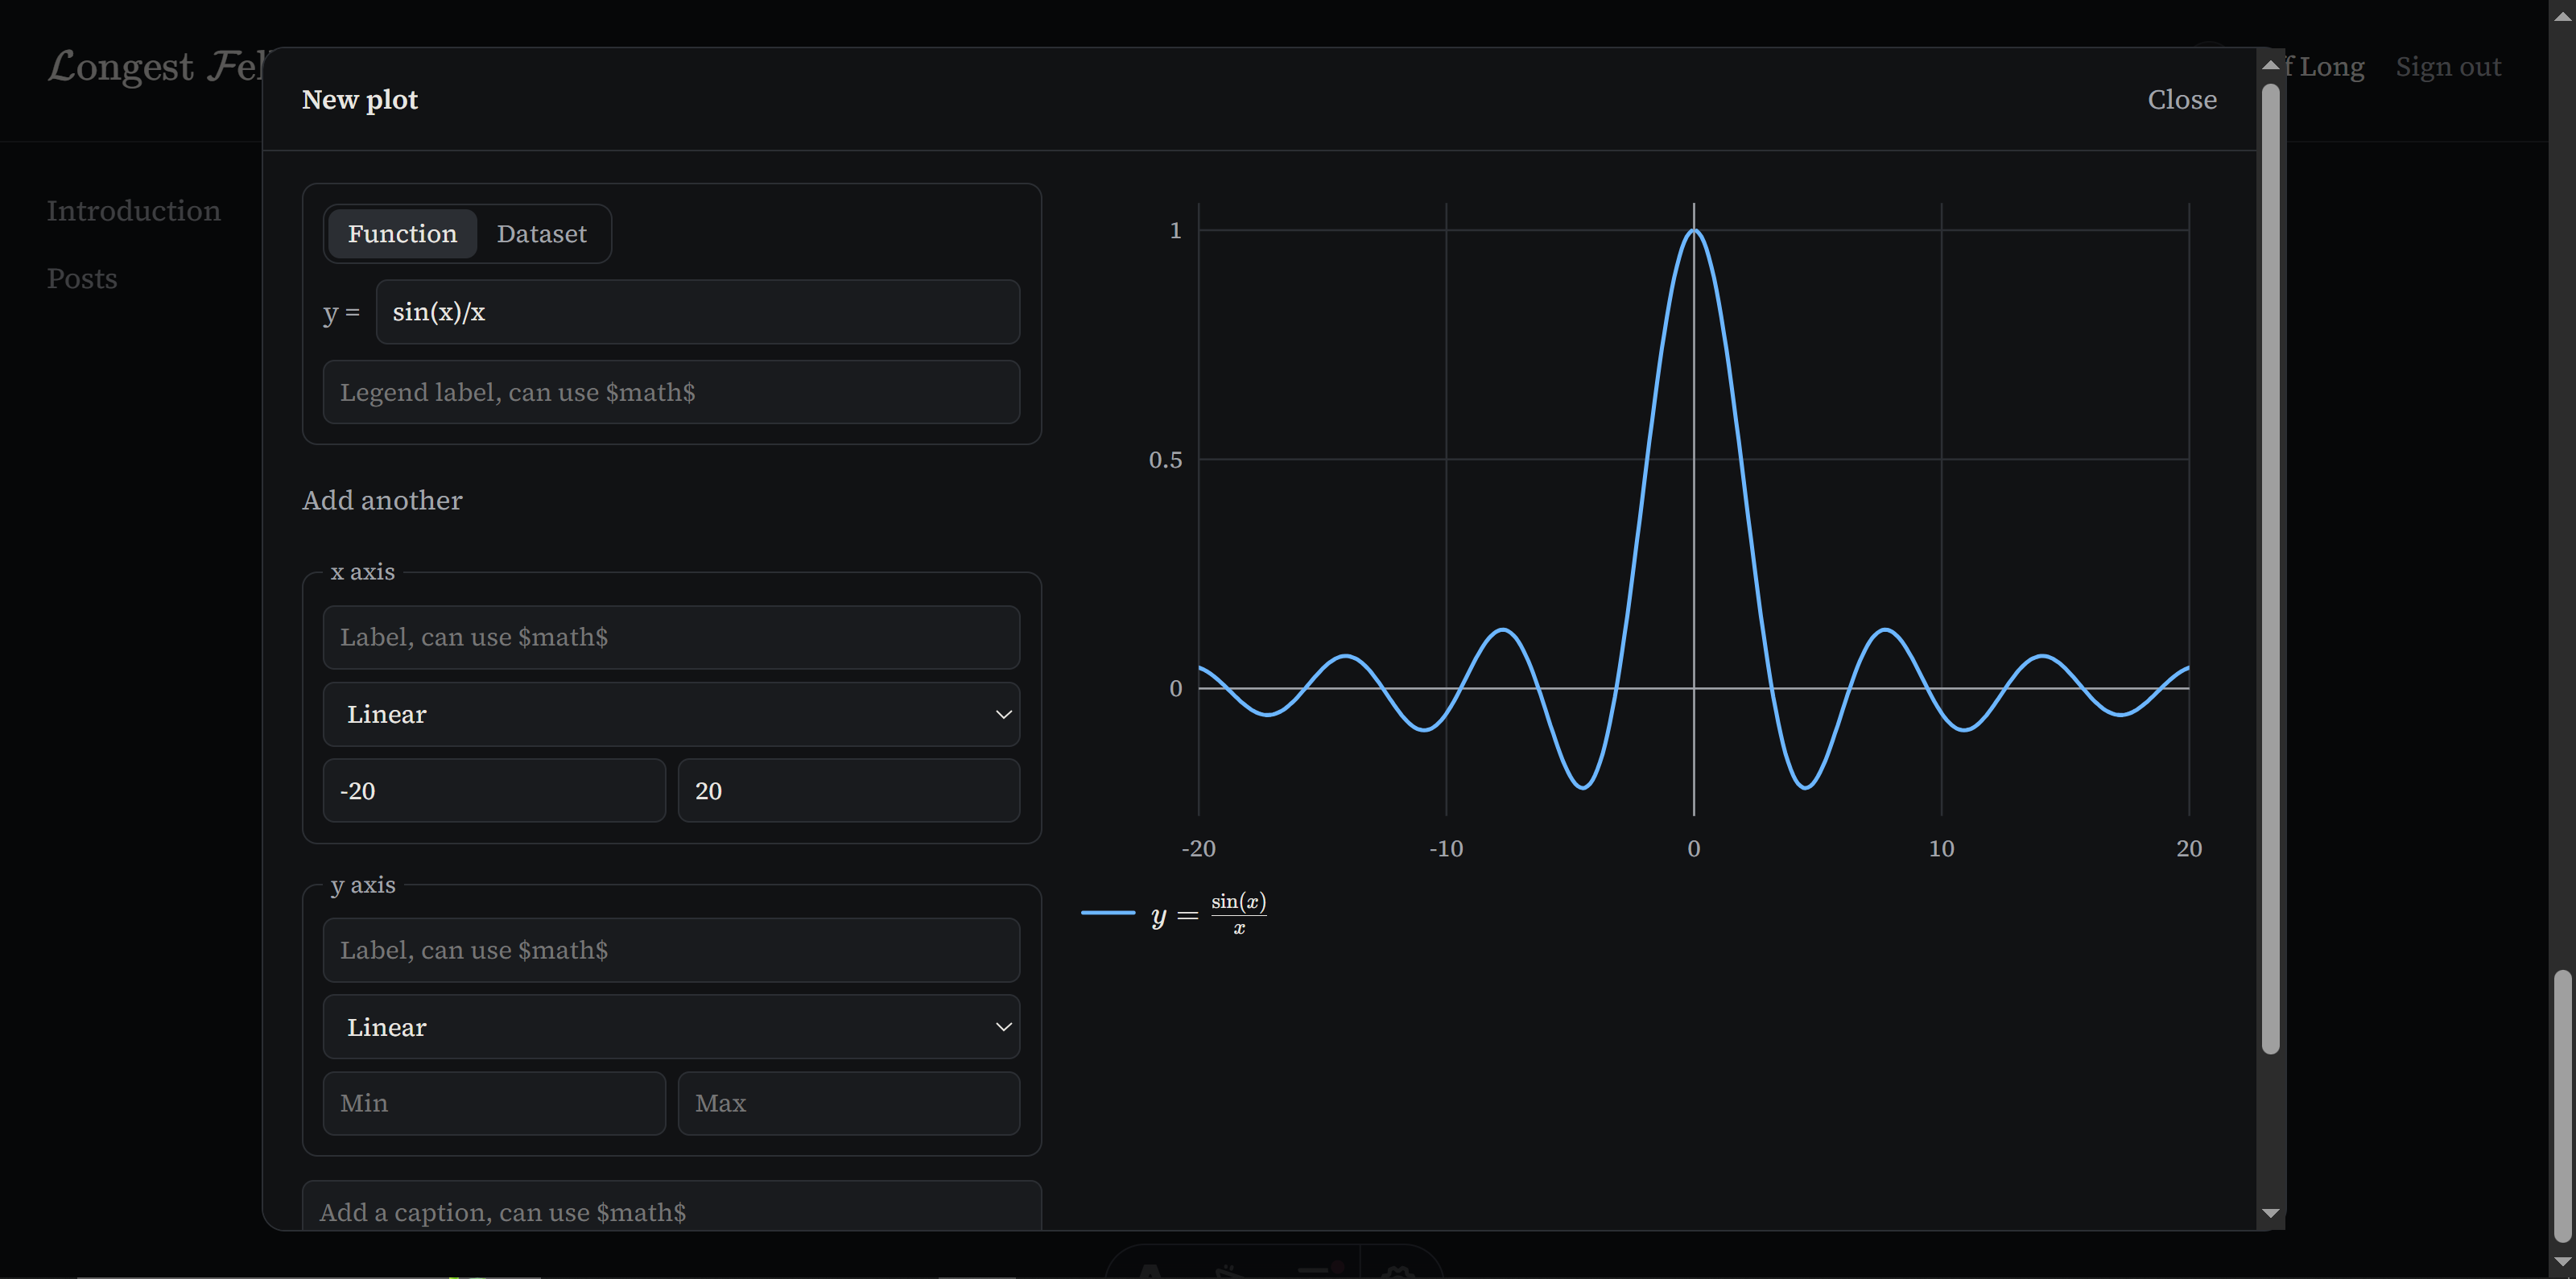
Hey, that's pretty dang handy. What if I just have a graph I want to plot? Again, no need to go anywhere else, just plop in a /plot2d macro and graph away, like so:
Again with the screenshot showing the interface - no AI here, at least right now. AI's best when its constrained to the use cases where it really shines - a 2D graph of function is usually simple enough that it doesn't need AI.
Where's this project going?
Who knows? It'll likely be just me using it for Jeff stuff for a while. I think some more broad goals that would be cool to address here would be the peer review bottleneck we're seeing in mathematics right now, that's only going to get more constrained over time. I have some ideas around that, like more facilitated feedback mechanisms built around these posts.
The mathematics process in general, as an outside observer, seems rife for process optimization. And if trends continue, the field is going to need it to keep up with demand.
I've started to build in some very tailored functionality around this use case, like structured citations, theory, lemmas, multi-pane figures, etc. We'll see where that goes.